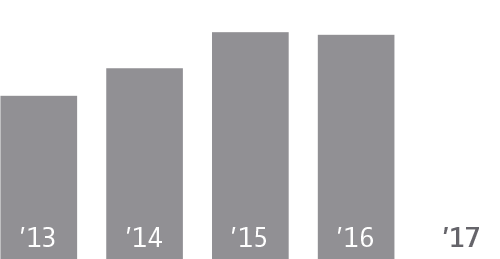
| Operating Revenues
(in millions)
|
$23,031 |
$19,896 |
15.8% |
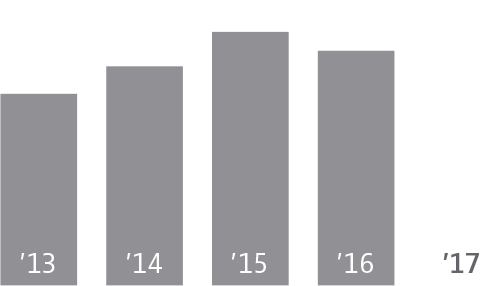
| Earnings
(in millions)
|
$842 |
$2,448 |
(65.6)% |
| Basic Earnings Per Share |
$0.84 |
$2.57 |
(67.3)% |
| Diluted Earnings Per Share |
$0.84 |
$2.55 |
(67.1)% |
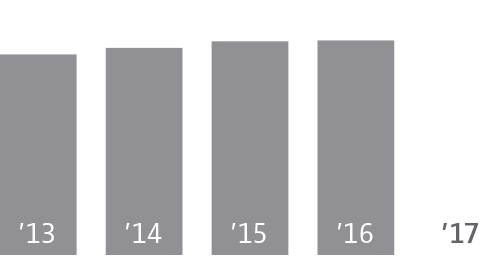
| Dividends Per Share
(amount paid)
|
$2.30 |
$2.22 |
3.6% |
| Dividend Yield
(year-end, percent)
|
4.8 |
4.5 |
6.7% |
| Average Shares Outstanding
(in millions)
|
1000 |
951 |
5.2% |
| Return On Average Common Equity
(percent)
|
3.44 |
10.80 |
(68.1)% |
| Book Value Per Share |
$23.99 |
$25.00 |
(4.0)% |
| Market Price Per Share
(year-end, closing)
|
$48.09 |
$49.19 |
(2.2)% |
| Total Market Value Of Common Stock
(year-end, in millions)
|
$48,456 |
$48,717 |
(0.5)% |
| Total Assets
(in millions)
|
$111,005 |
$109,697 |
1.2% |
| Total Kilowatt-Hour Sales
(in millions)
|
205,541 |
197,788 |
3.9% |
| Retail |
156,507 |
160,745 |
(2.6)% |
| Wholesale |
49,034 |
37,043 |
32.4% |
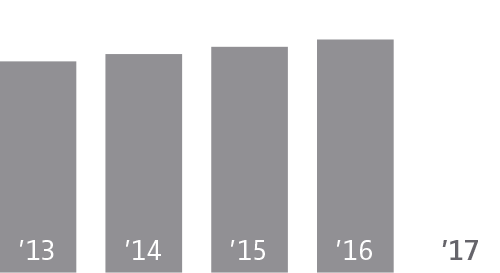
| Total Utility Customers
(year-end, in thousands)
|
9,263 |
9,179 |
0.9% |